Small Business Dynamism
Identifying Prime Growth Small Businesses for Impact Investors
30 April 2026
By Steve Waters
Founder & CEO, SMB Intelligence
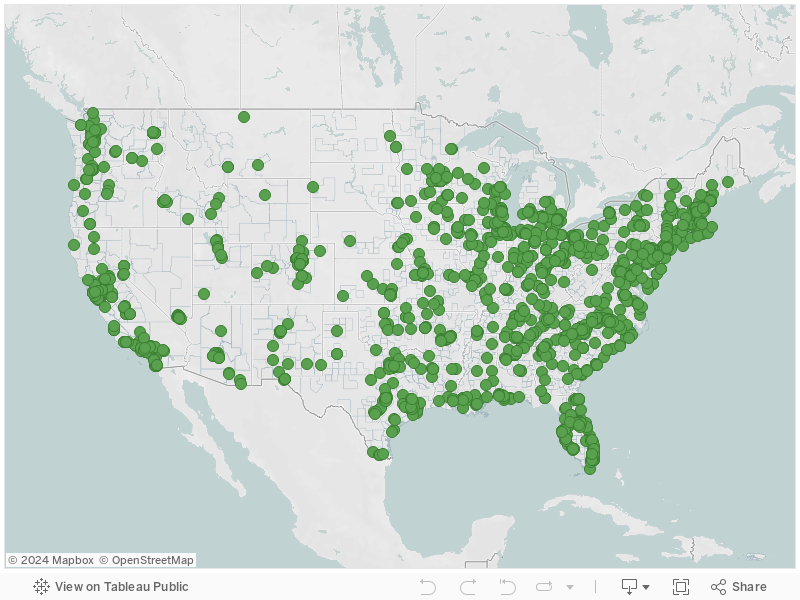
This continually updated map identifies current prime growth small businesses in the US that are minority or women-owned, and / or are located in an economically distressed community. We define a distressed community as a census tract whose median income is less than 80% of the median income of the surrounding metro area.
Prime growth small businesses are independents or small chains, that are employers with a commercial location, that are currently at a seed (new, pre-opening) or expansion (high growth) development stage. They are the small businesses currently most likely to be growth-motivated and receptive to new solutions, and if they are successful in their current growth plans, to experience substantial growth and create new jobs.
When owners can access a strong small business ecosystem and access the right mix of solutions, they are nearly twice as likely to grow and create new jobs than small businesses in general1. However, there is often a disconnect in the ecosystem between providers of solutions and the owners they are meant for.
Growth-motivated owners often struggle to navigate the ecosystem themselves to access the solutions they need at the right time2, particularly women3 and minority-owned4 firms and those located in economically distressed communities5.
Providers often struggle to navigate a massive sector where most owners are motivated by lifestyle, not growth6, and the vast majority are not receptive to new solutions7, will not experience substantial growth, and do not create new jobs8.
The purpose of this dataset is to help Impact Funds maintain a high-level view of current prime growth firms – the often overlooked small businesses that could potentially create both positive returns and social impact. The complete dataset includes full firm and contact info.
The map is interactive, hover on a pinpoint to view the available insight.
Request access to this dataset.
2. Thirty-three percent of all owners reported job openings they could not fill in the current period. NFIB. “May 2018 Report: Small Business Optimism Index”, May 2018. Available online. 23% of employer firms who applied for credit did not receive any, and 54% had a financing shortfall, meaning they received less than what they applied for. Federal Reserve Bank. “2017 Small Business Credit Survey – Report on Employer Firms”, 2017. Available online. Right now resources are not, for whatever reason, getting to the right people and the right places to spur economic development—particularly in under-invested parts of the urban core. Knox, Ron. “The Hunt for an Entrepreneurial Ecosystem”, Citylab, September, 2017. Available online. Small business owners are often unaware of the many resources available to them, and struggle to navigate Boston’s currently disconnected business support environment. City of Boston Small Business Report, Page 27, March 2016. Available online.
3. Federal Reserve Banks of New York and Kansas City, “Small Business Credit Survey – Report on Women-Owned Firms”, November 2017. Available online.
4. Brookings Institute Hamilton Project, “Minority and Women Entrepreneurs: Building Capital, Networks, and Skills”, March 2015. Available online.
5. Kugler, Maurice and Marios Michaelides, Neha Nanda, Cassandra Agbayani, “Entrepreneurship in Low-Income Areas”, page 1, IMPAQ International LLC for Small Business Administration, September 2017. Available online.
6. Only 24% of owners report wanting their firm to be “as large as possible”, and more than 50% of owners cite lifestyle benefits such as “flexibility over schedule” or “be my own boss” as a primary reason for starting their firm. Pugsley, Benjamin Wild and Erik Hurst. “What Do Small Businesses Do?”, Brookings Papers On Economic Activity, Fall 2011. Available online. Only 33% of owners say their primary goal is to grow. The Hartford. “2015 Small Business Success Study”, 2015. Available online. 50% of owners started their business for non-financial reasons like wanting to be their own boss, tired of working for others, wanting to set their own hours, and the desire to pursue a passion. Only 12% of owners want to grow to staff larger than 50 people. Infusionsoft. “Defining and Achieving Small Business Success”, 2016. Available online. While 88% of owners report “increasing revenues” as their key business goal over the next three years, only 24% report wanting to add an establishment. Shopkeep. “2018 Shopkeep Small Business Pulse”, May 2018. Available online.
7. In a given year for a given category, only 7% of small business owners reported switching their solution provider, and 68% reported never switching. Haque, Naumi. “Small Business Owners Never Switch Suppliers”, CEB, October 28, 2012. Available online. Waters, Steve. “Why the Vast Majority of Small Businesses are Unreceptive to New Solutions”, SMB Intelligence, May 2018. Available online.
8. The overwhelming majority of small firms do not grow by adding employees from year to year or even over three year periods. Approximately 80% of small businesses do not grow at all, even over a relatively long period. Most surviving small businesses do not grow by any substantial margin – most start small and stay small. Pugsley, Benjamin Wild and Erik Hurst. “What Do Small Businesses Do?”, Brookings Papers On Economic Activity, Fall 2011. Available online Only 22% of small businesses are planning to hire additional employees in the next 12 months. Bank of America. “Small Business Owner Report”, Spring 2018. Available online. 22% of owners are planning to hire new employees in 2018. TD Bank. “2018 Small Business Survey”, May 2018. Available online. 71% of owners expect savings from the 2017 tax policy changes, however only 14% of those plan to use those savings to hire more employees. Bank of America. “Small Business Owner Report”, Spring 2018. Available online. Seasonally adjusted net 20% (of small business owners) plan to create new jobs. NFIB. “NFIB Small Business Jobs Report”, NFIB, June 2018. Available online. Over the next 12 months 31% of small business owners expect the overall number of jobs at their company to increase, 62% expect it to stay the same, and 7% expect a decrease. Wells Fargo. “2018 Small Business Index Survey”, April 2018. Available online.
Prime growth small businesses are sourced from our bi-weekly Prime Growth Briefing. SMB Intelligence uses proprietary open-source intelligence (OSINT) methods applied through a combination of machine analysis and human analytics to continually monitor over 30,000 real estate, editorial, public government data, social media and other sources to track planned growth activity in the small business sector. We apply Prime Growth Classification to that data to identify prime growth firms, and then aggregate additional data points to determine key characteristics including their current job creation status, contact details and digital engagement. We then geocode each prime growth firm, assign a US census tract, and use extensive public government data to determine the current socioeconomic status of the community each firm is located in.
Firm format is either independent or small chain. We define an independent as a single establishment (location) firm with less than 500 employees. It’s important to note that while we include firms with up to 500 employees, nearly all (98%) of small businesses have less than 100 employees, and 96% have less than 50. We define a small chain as any firm with more than 1 and less than 20 establishments. This also applies to firms with several establishments that are not normally perceived as “chains”, such as tech and manufacturing companies with several office locations.
Employer firm confirms that the firm is an employer – they have employees beyond the owner, accuracy is 98%. All prime growth firms are employers (or in the case of seed stage firms, they will be once they launch).
Commercial location confirms that the firm is not operating from a residence, accuracy is 98%. All prime growth firms have commercial locations (or in the case of seed stage firms, they will once they launch).
Job creation status is determined through a proprietary process, accuracy is 97%. Current means the firm is currently hiring for newly created jobs. Near future means the firm will be adding newly created jobs in the near future.
Opening or expansion date determines when the firm opening or expansion is scheduled for. Firms with “current” status are expansion stage firms who have recently closed a substantial funding round. SMB Intelligence clients can access specific opening / expansion timeframes.
Minority-owned determines if the owner of the firm is a member of a minority group. We use a proprietary process to determine minority-owned status, accuracy is 87%.
Women-owned determines if the owner of the firm is a woman. We use a proprietary process to determine women-owned status, accuracy is 96%.
Prime growth segment determines which Prime Growth segment the firm is categorized as. Prime Growth Classification groups prime growth firms into one of nine segments based on their current growth priorites. Growth priorities define the format and scale of growth an owner is currently working to accomplish. Learn more about Prime Growth Classification.
Opportunity Zones are a new community development program established by Congress in the Tax Cuts and Jobs Act of 2017 to encourage long-term investments in low-income urban and rural communities nationwide. The Opportunity Zones program provides a tax incentive for investors to re-invest their unrealized capital gains into Opportunity Funds that are dedicated to investing into Opportunity Zones designated by the chief executives of every U.S. state and territory. Learn more at Economic Innovation Group. Opportunity Zone designation is based on the June 14, 2018 dataset from the Department of Treasury CDFI Fund.
Low income tract determines if the median income of the tract the firm / establishment is located in is less than 80% of the median income of the surrounding metro area, based on 5 Year ACS Data 2012-2106 (the latest available).
Concentrated poverty determines if a tract has more than 40% of individuals living at or below the poverty line, or is three or more times the average tract poverty rate for the metro / micro area, whichever is lower. Data is from the Department of Housing and Urban Development 2018 Areas of Concentrated Poverty File, and is based on 5 Year ACS Data 2012-2016.
ReCap (Ethnically concentrated areas of poverty) determines if an area of concentrated poverty has a non-white population of more than 50%, or if it’s outside of a metro / micro area, a non-white population of more than 20%. Data is from the Department of Housing and Urban Development 2018 Areas of Concentrated Poverty File, and is based on 5 Year ACS Data 2012-2016.
Area economic index provides insight into the level of economic distress or advantage of the census tract the firm / establishment is located in, in relation to the surrounding metro area. The index is calculated by dividing the median income of the census tract by the median income of the metro statistical area based on 5 year ACS data 2012-2016, providing a percentage. We define under 80% as economically distressed, and over 120% as advantaged.
FEMA disaster area determines if the census tract is located in a county designated a disaster area eligible for individual assistance within the previous three years. Data is from FEMA, 2018.